
Elite Investor Kenneth Mowat uses an example of a successful Gold trade to illustrate how you can determine the best entry point, how to set a stop-loss level, how to calculate take profit target, and how to set an exit strategy for maximum profitability.
Hello, traders. There are 6 things you should know before entering a trade:
- Reason for entering a trade (how to spot a buy or sell signal)
- How to determine the best entry price
- How to set a stop-loss level
- What percentage of your equity should you risk
- How to calculate a take-profit target
- How to create an exit strategy
To get an idea of how all this works in practice, let’s take a quick look at an example trade setup that took place in Gold:
1. How to spot a buy or sell signal
Determine the trend and pattern
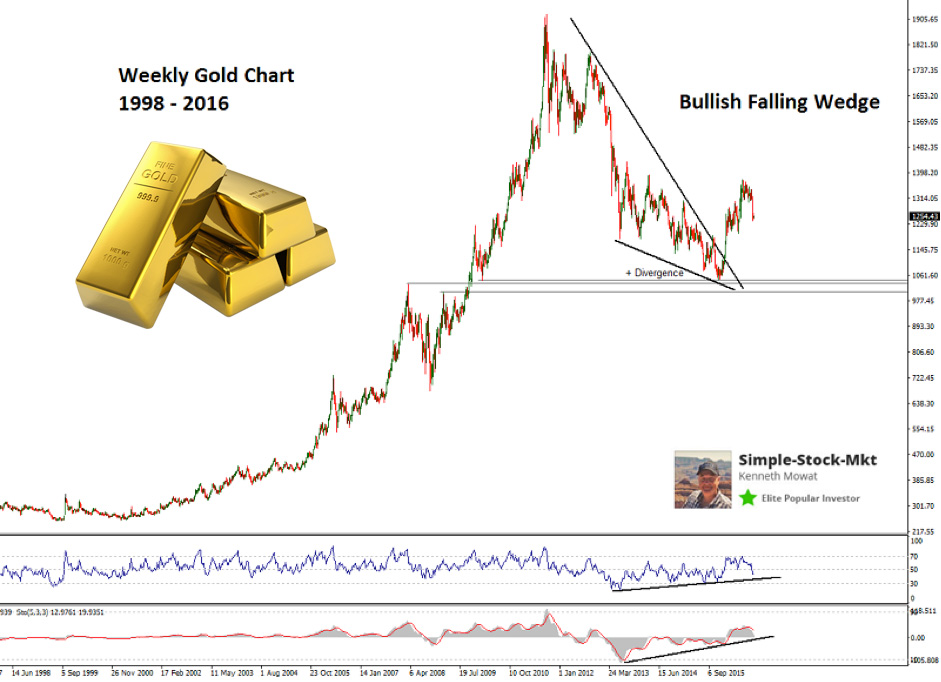
Looking at the long-term chart of the price of Gold above, we can see that this market previously enjoyed a fantastic multi-year rally that began in the late 1990s when there was a huge increase in price from a low of $250. This rally eventually peaked at around $1850 in 2011, and since then, it has been in a consistent downtrend, which has developed into a falling wedge pattern. Falling wedges are a common, fairly reliable bullish chart pattern, so we typically expect to see prices break out to the upside.
Look at technical indicators
To increase the odds of entering a profitable trade, we can also look at technical indicators for some confirmation. We can see in the chart above that as the downtrend continues lower, indicators are beginning to turn upwards, creating a divergence between price and indicators. This divergence is a sign that the strength of the downtrend is weakening.
We can also see that price is approaching a point where there is a potential to gain some support from previous significant support and resistance levels.
Now that we have Gold on our radar as a potential buy trade let’s zoom in on a daily chart
We can see that there is also a positive divergence between price and indicators on the daily chart:
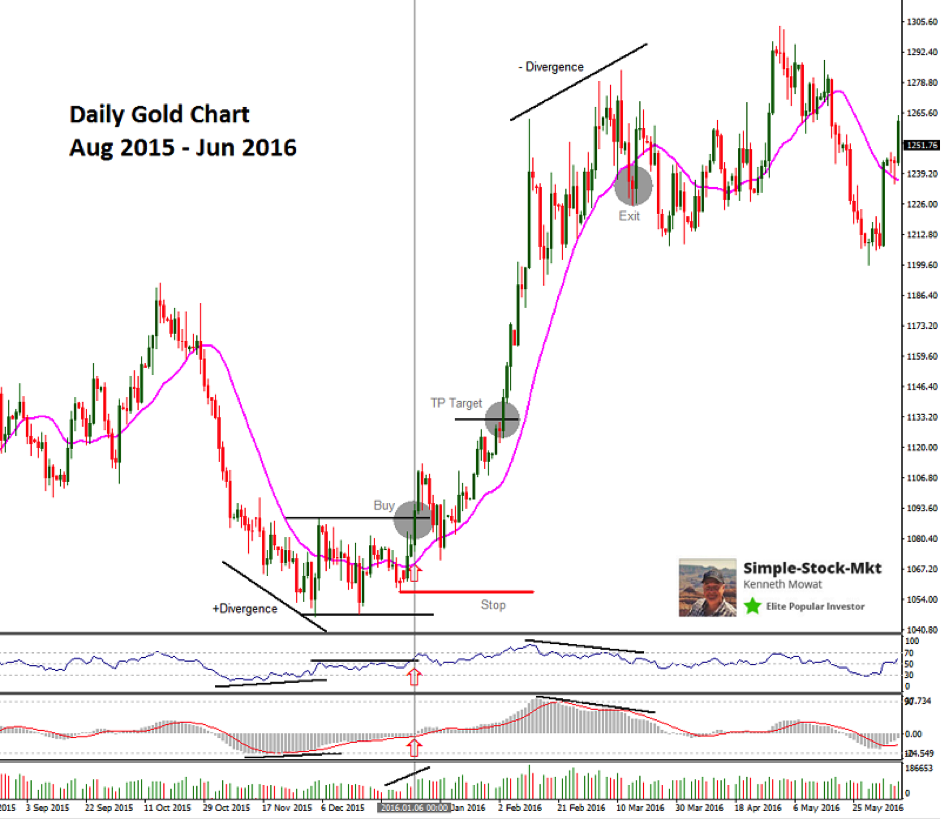
We now need to fine-tune our entry point and look for a buy signal. There is a potential double bottom at the low, and although we could have taken a speculative position as soon as this had formed, it is better to wait for a buy signal to reduce the risk of a losing trade by getting in too early.
2. Fine-tune and determine the best entry point/price
The buy signal was triggered at 1088.65 on 6th Jan, as the price broke out higher through to the top of the double bottom pattern. We can see that the technical indicator confirmed this break higher, so it is now time to enter a buy trade.
3. How to set a stop-loss level
Although we now have very good reasons for entering a trade, it is important to remember that there are never any guarantees and the price can just as easily start to turn lower again. Anything can happen at any time. Who knows what unpredictable event might happen anywhere in the world that might affect the price of gold? We must set a stop-loss to protect us from any unaffordable losses.
In this case, a break back below 1071.15 would indicate a failure of the double bottom pattern, so a stop-loss should be placed just below this.
4. What percentage of your equity should you risk
Through our entry and stop-loss prices, we now know that we would be risking around 18 points on this trade. We should calculate our trade size to ensure that we are not risking any more than the 1-2% maximum used in our strategy.
5. How to set a take-profit target
The price target derived from a double bottom pattern is found by calculating the distance from the low to the high of the pattern and then adding it to the high. In this case, we calculate our take-profit target to be 1128.95 as shown below.
1088.15 – 1047.35 = 40.8 points
1088.15 + 40.8 = 1128.95
6. How to create an exit strategy
Trend reversal patterns such as the double bottom can sometimes fail to reach their target before reversing again. However, they do very often mark a larger change in trend.
As such, they regularly yield far better gains than the minimum price target offers. One highly effective way of maximizing our potential gains from each trade whilst still protecting ourselves against unnecessary losses is only to close part of the position on the take-profit target.
This strategy effectively locks in some of the profits, and we can then try to run the other part of the trade whilst protecting some of the remaining profits with a trailing stop.
In this case, we could take profits on ½ the trade at 1128.95 and then use the 20-day moving average as a trailing stop indicator to let the other half of the trade run until we get an exit signal.
The exit signal on this trade came at 1242.69 on 14th March 2016 when the price broke the 20-day moving average. There was an indication that a reversal was coming as we could see in advance that the trend was weakening due to the appearance of a negative divergence between price and the technical indicators. There may have been an opportunity to tighten the stop and close the position sooner with slightly better gains.
Results
With a potential take-profit target of 40.8 points and a maximum risk of 18 points, this trade offered a good risk-versus-reward ratio of over 2:1. Had we closed all of the trade on the take-profit target, we would have banked around 40 points. However, by utilizing the trailing stop strategy, we would have banked 40 points on half of the trade and 154 points on the second half of the trade, effectively more than doubling our profit to an average gain of 97 points.
